

 Thai
Thai


ข้อมูลจำเพาะ Micron 9550 MAX
ตารางด้านล่างแสดงรายการ SSD ตระกูล Micron 9550 MAX โดยเน้นรูปแบบ (form factors) ตัวชี้วัดประสิทธิภาพ ระดับความทนทาน และตัวเลือกความจุสำหรับรุ่น U.2 และ E3.S
| ข้อมูลจำเพาะ Micron 9550 MAX (U.2 / E3.S) | |||||
|---|---|---|---|---|---|
| กรณีการใช้งาน | การใช้งานแบบผสมผสาน (3 การเขียนไดรฟ์ต่อวัน) | ||||
| อินเทอร์เฟซ / โปรโตคอล | PCIe Gen5 x4, NVMe v2.0b | ||||
| NAND | Micron 232-layer 3D TLC NAND | ||||
| การปฏิบัติตาม OCP | OCP 2.0 (r21) | ||||
| ความน่าเชื่อถือ | MTTF: 2.0M ชั่วโมง @ 0–55°C; 2.5M ชั่วโมง @ 0–50°C | UBER < 1 sector per 1017 bits read | รับประกัน 5 ปี | ||||
| กำลังไฟ (เฉลี่ย RMS) | ≤ 18 W sequential read; ≤ 18 W sequential write | ||||
| อุณหภูมิการทำงาน | 0–70 °C | ||||
| ความจุและประสิทธิภาพ (9550 MAX) | |||||
| ความจุ | Seq. Read (MB/s) | Seq. Write (MB/s) | Rand. Read (K IOPS) | Rand. Write (K IOPS) | 70/30 R/W (K IOPS) |
| 3.2TB | 14,000 | 10,000 | 3,000 | 540 | 640 |
| 6.4TB | 14,000 | 10,000 | 3,300 | 640 | 720 |
| 12.8TB | 14,000 | 10,000 | 3,300 | 820 | 1,000 |
| 25.6TB | 14,000 | 10,000 | 3,300 | 1,200 | 1,300 |
| ความหน่วงทั่วไป (µs) | |||||
| อ่าน | 60 | ||||
| เขียน | 15 | ||||
| ความทนทาน (Total Bytes Written, TB) | |||||
| ความจุ | RND TBW | SEQ TBW | หมายเหตุ | ||
| 3.2TB | 17,520 | 37,200 | MAX (3 DWPD) | ||
| 6.4TB | 35,040 | 74,200 | MAX (3 DWPD) | ||
| 12.8TB | 70,080 | 143,100 | MAX (3 DWPD) | ||
| 25.6TB | 140,160 | 282,600 | MAX (3 DWPD) | ||
การออกแบบและโครงสร้าง Micron 9550 MAX
Micron วางตำแหน่ง 9550 MAX เป็น SSD ระดับองค์กรแบบผสมผสาน (mixed-use) ที่ออกแบบมาสำหรับเวิร์กโหลดการอ่าน/เขียนที่สมดุลที่ 3 DWPD มันจับคู่กับอินเทอร์เฟซ PCIe Gen5 x4 พร้อมการรองรับโปรโตคอล NVMe 2.0b และเทคโนโลยี Micron 232-layer 3D TLC NAND เพื่อเน้นความหน่วงที่สม่ำเสมอภายใต้ภาระงานที่ต่อเนื่อง
ในทางกายภาพ ตระกูลไดรฟ์นี้มีรูปแบบ U.2 และ E3.S ทำให้ผู้ปฏิบัติงานมีความยืดหยุ่นในการติดตั้งในช่อง NVMe ขนาด 2.5 นิ้วปัจจุบัน หรือย้ายไปยังการใช้งาน EDSFF ที่หนาแน่นขึ้นโดยไม่ต้องเปลี่ยนแพลตฟอร์ม ความอเนกประสงค์นี้เสริมด้วยการปฏิบัติตาม OCP 2.0 และ 2.5 ทำให้ 9550 MAX สอดคล้องกับความคาดหวังด้านกลไก ความร้อน และการจัดการที่พบได้ทั่วไปในเซิร์ฟเวอร์ hyperscale และระดับองค์กรสมัยใหม่
ในด้านพลังงานและความร้อน Micron ระบุว่าใช้พลังงานเฉลี่ย RMS ≤18 W สำหรับการดำเนินการอ่านและเขียนแบบต่อเนื่อง ซึ่งเข้ากันได้ดีกับซองระบายความร้อนช่องหน้าทั่วไปสำหรับระบบ U.2 และ E3.S และช่วยรักษาความสม่ำเสมอของประสิทธิภาพระหว่างเวิร์กโหลดแบบผสมผสานที่ยาวนาน อุณหภูมิการทำงานอยู่ที่ 0–70 °C ทำให้ผู้ดูแลระบบมีพื้นที่ทำงานที่สะดวกสบายในดีไซน์การไหลเวียนอากาศของแชสซีที่หลากหลาย
เป้าหมายความน่าเชื่อถือสะท้อนถึงการเน้นความทนทานของสาย MAX: MTTF สูงสุด 2.5 ล้านชั่วโมง (2.0 ล้านชั่วโมงที่อุณหภูมิแวดล้อมสูงขึ้น) UBER < 1e-17 และการรับประกันห้าปี ความจุมีตั้งแต่ 3.2TB ถึง 25.6TB และ Micron เผยแพร่ตัวเลขความหน่วงทั่วไปที่ต่ำ (60 µs อ่าน / 15 µs เขียน) ควบคู่ไปกับอัตราปริมาณงาน Gen5 (สูงสุด 14 GB/s อ่าน / 10 GB/s เขียน) และตัวเลข mixed-IO ที่น่าประทับใจ คุณลักษณะเหล่านี้มีความสำคัญมากกว่าสเปกสูงสุดในการใช้งานแบบผสมผสานจริง
ประสิทธิภาพ Micron 9550 MAX
แพลตฟอร์มทดสอบไดรฟ์
เราเลือก Dell PowerEdge R760 ที่ใช้ Ubuntu 22.04.02 LTS เป็นแพลตฟอร์มทดสอบสำหรับเวิร์กโหลดทั้งหมดในการรีวิวนี้ ระบบนี้ติดตั้ง Serial Cables’ Gen5 JBOF ทำให้มีความเข้ากันได้กว้างขวางกับ SSD U.2, E1.S, E3.S และ M.2 การกำหนดค่าระบบทดสอบของเราแสดงไว้ด้านล่าง
- 2 x Intel Xeon Gold 6430 (32-Core, 2.1GHz)
- 16 x 64GB DDR5-4400
- 480GB Dell BOSS SSD
- Serial Cables Gen5 JBOF
ไดรฟ์ที่เปรียบเทียบ
- Pascari X200P 7.68TB
- SanDisk SN861 7.68TB
- Solidigm PS1010 7.68TB
- Kingston DC3000ME 7.68TB
- Micron 7600 Max 6.4TB
DLIO Checkpointing Benchmark
เพื่อประเมินประสิทธิภาพจริงของ SSD ในสภาพแวดล้อมการฝึกอบรม AI เราได้ใช้เครื่องมือ DLIO benchmark (Data and Learning Input/Output) DLIO พัฒนาโดย Argonne National Laboratory ออกแบบมาเพื่อทดสอบรูปแบบ I/O ในเวิร์กโหลด deep learning โดยเฉพาะ ให้ข้อมูลเชิงลึกว่าระบบจัดเก็บข้อมูลจัดการกับความท้าทายต่างๆ เช่น การบันทึกจุดตรวจสอบ (checkpointing) การนำเข้าข้อมูล และการฝึกอบรมโมเดลอย่างไร แผนภูมิด้านล่างแสดงให้เห็นว่าไดรฟ์ทั้งสองจัดการกระบวนการนี้อย่างไรตลอด 36 จุดตรวจสอบ เมื่อฝึกอบรมโมเดล machine learning จุดตรวจสอบมีความสำคัญสำหรับการบันทึกสถานะของโมเดลเป็นระยะๆ เพื่อป้องกันการสูญเสียความคืบหน้าระหว่างการหยุดชะงักหรือไฟฟ้าดับ ความต้องการในการจัดเก็บข้อมูลนี้ต้องการประสิทธิภาพที่แข็งแกร่ง โดยเฉพาะอย่างยิ่งภายใต้เวิร์กโหลดที่ต่อเนื่องหรือเข้มข้น เราใช้ DLIO benchmark เวอร์ชัน 2.0 จากการเผยแพร่เมื่อวันที่ 13 สิงหาคม 2024
เพื่อให้แน่ใจว่าการวัดประสิทธิภาพของเราสะท้อนสถานการณ์จริง เราได้ทำการทดสอบตามสถาปัตยกรรมโมเดล LLAMA 3.1 405B เราใช้ torch.save() ในการบันทึกจุดตรวจสอบเพื่อจับพารามิเตอร์โมเดล สถานะตัวปรับปรุง (optimizer states) และสถานะเลเยอร์ การตั้งค่าของเราจำลองระบบแปด GPU โดยใช้กลยุทธ์การขนานแบบไฮบริด (hybrid parallelism) ด้วยการขนานเทนเซอร์แบบ 4 ทาง และการประมวลผลแบบไปป์ไลน์แบบ 2 ทางที่กระจายไปทั่วแปด GPU การกำหนดค่านี้ให้ขนาดจุดตรวจสอบ 1,636 GB ซึ่งสะท้อนถึงข้อกำหนดสำหรับการฝึกอบรมโมเดลภาษาขนาดใหญ่สมัยใหม่
ในการวัดประสิทธิภาพนี้ Micron 9550 MAX 12.8TB กลายเป็นผู้นำที่ชัดเจน ตลอดการทดสอบ 18 จุดตรวจสอบเต็มรูปแบบ ไดรฟ์นี้รักษาเวลาเฉลี่ยในการดำเนินการที่ต่ำที่สุด โดยอยู่ในช่วง 457 ถึง 575 วินาที ไดรฟ์นี้แสดงความเสถียรที่ยอดเยี่ยมด้วยความแปรปรวนน้อยที่สุดระหว่างจุดตรวจสอบ ซึ่งบ่งชี้ถึงการออกแบบเฟิร์มแวร์ที่สมดุลซึ่งปรับให้เหมาะสมกับเวิร์กโหลดแบบผสมผสาน (read/write)
ตามมาอย่างใกล้ชิดคือ Micron 7600 MAX 6.4TB ซึ่งให้เวลาอยู่ระหว่าง 459 ถึง 586 วินาที แม้ว่าค่าเฉลี่ยจะยังคงแข่งขันได้ แต่ไดรฟ์นี้แสดงความผันผวนของประสิทธิภาพในช่วงสั้นๆ ระหว่างจุดตรวจสอบที่ 4 ถึง 7 ก่อนที่จะกลับมาเสถียรในช่วงท้ายของการทดสอบ อย่างไรก็ตาม ไดรฟ์นี้ยังคงอยู่ในกลุ่มชั้นนำ แสดงประสิทธิภาพที่ยอดเยี่ยมสำหรับเวิร์กโหลด AI และ HPC ที่ต่อเนื่อง
Micron 9550 7.68TB ทำงานได้ตามหลังรุ่นเรือธงทั้งสองรุ่น โดยมีผลลัพธ์อยู่ในช่วง 458 ถึง 582 วินาที มันรักษาการปรับขนาดที่สม่ำเสมอและยังคงแข่งขันกับไดรฟ์ MAX ระดับสูงกว่าได้ ซึ่งตอกย้ำความแข็งแกร่งของแพลตฟอร์ม Micron 9550 ที่อยู่เบื้องหลัง
ในบรรดา SSD ระดับองค์กรอื่นๆ ที่ทดสอบ Solidigm PS1010, SanDisk SN861 และ Kingston DC3000ME อยู่ในกลุ่มกลาง โดยใช้เวลาส่วนใหญ่ในการดำเนินการจุดตรวจสอบในช่วง 450 ถึง 610 วินาที Pascari X200P แสดงประสิทธิภาพที่สม่ำเสมอน้อยที่สุด โดยใช้เวลามากกว่า 690 วินาทีในช่วงกลางของการทดสอบก่อนที่จะกลับมาเสถียรในช่วงท้าย
ในการทดสอบค่าเฉลี่ยต่อรอบนี้ Solidigm PS1010 7.68TB เป็นผู้นำกลุ่มด้วยเวลาเฉลี่ยในการดำเนินการที่เร็วที่สุด โดยอยู่ในช่วง 458 ถึง 564 วินาที ตลอดสามรอบ ไดรฟ์นี้แสดงความสม่ำเสมอที่ยอดเยี่ยม รักษาความแปรปรวนต่ำระหว่างรอบ และแสดงประสิทธิภาพที่แข็งแกร่งภายใต้เวิร์กโหลด I/O แบบผสมผสาน
SanDisk SN861 7.68TB ตามมาอย่างใกล้ชิด โดยมีผลลัพธ์เกือบจะเหมือนกัน โดยมีค่าเฉลี่ยระหว่าง 461 ถึง 553 วินาที ยืนยันความสามารถในการให้ประสิทธิภาพการบันทึกจุดตรวจสอบที่เชื่อถือได้โดยมีการเสื่อมสภาพน้อยที่สุด
Micron 9550 7.68TB ตามมา โดยเสร็จสิ้นในช่วง 461 ถึง 559 วินาที ในรอบเดียวกัน ประสิทธิภาพยังคงแข่งขันได้สูง โดยตามหลังผู้นำเพียงเล็กน้อย ในขณะที่ยังคงรักษาการปรับขนาดที่เสถียรและปริมาณงานที่แข็งแกร่งตลอดทุกรอบการทำงาน
Micron 9550 MAX 12.8TB และ Micron 7600 MAX 6.4TB อยู่ในห้าอันดับแรก โดยมีค่าเฉลี่ยสูงกว่าเล็กน้อยที่ 462–555 วินาที และ 464–567 วินาที ตามลำดับ ทั้งสองไดรฟ์แสดงพฤติกรรมที่สม่ำเสมอตลอดเวลา แต่ตามหลัง Micron ที่มีความจุต่ำกว่า และไดรฟ์ชั้นนำสองตัวจากSolidigm และ SanDisk
ในบรรดากลุ่มที่เหลือ Kingston DC3000ME และPascari X200P มีเวลาโดยรวมสูงสุด โดยมีค่าเฉลี่ย 580 วินาที และ 660 วินาที ตามลำดับ ผลลัพธ์เหล่านี้สะท้อนถึงช่องว่างประสิทธิภาพที่กว้างขึ้นภายใต้เงื่อนไขการบันทึกจุดตรวจสอบที่ต่อเนื่อง โดยเฉพาะอย่างยิ่งสำหรับเวิร์กโหลดที่ต้องการการเขียนไปยังที่จัดเก็บข้อมูลถาวรบ่อยครั้ง
FIO Performance Benchmark
เพื่อวัดประสิทธิภาพการจัดเก็บข้อมูลของ SSD แต่ละตัวตามตัวชี้วัดอุตสาหกรรมทั่วไป เราใช้ FIO ไดรฟ์แต่ละตัวจะผ่านกระบวนการทดสอบเดียวกัน ซึ่งรวมถึงขั้นตอนการเตรียมการ (preconditioning) ด้วยการเขียนข้อมูลเต็มไดรฟ์สองครั้งด้วยเวิร์กโหลดแบบต่อเนื่อง ตามด้วยการวัดประสิทธิภาพในสภาวะคงที่ (steady-state) เมื่อประเภทเวิร์กโหลดที่วัดแต่ละประเภทเปลี่ยนแปลงไป เราจะทำการเขียนข้อมูลเตรียมการอีกครั้งสำหรับขนาดการถ่ายโอนใหม่นั้น
ในส่วนนี้ เราจะเน้นที่ FIO benchmarks ต่อไปนี้:
- 128K Sequential
- 64K Random
- 16K Random
- 4K Random
128K Sequential Write (IODepth 16 / NumJobs 1)
เมื่อเข้าสู่การทดสอบ 128K Sequential Write ผลลัพธ์เกือบจะเหมือนกับที่เราสังเกตเห็นระหว่างการเตรียมการ Micron 9550 Max (12.8TB) ยังคงเป็นผู้นำด้วยระยะห่างที่มาก โดยรักษาความเร็ว 10,957.9MB/s ไว้ที่อันดับสูงสุดของกลุ่ม Kingston DC3000ME (7.68TB) ตามมาเป็นอันดับสองที่ 8,477.4MB/s โดยมี Pascari X200P (7.68TB) ตามมาอย่างใกล้ชิดที่ 8,369.7MB/s
ตามหลังมาคือ Solidigm PS1010 (7,126.5MB/s) และ SanDisk DC SN861 (7,116.5MB/s) ในขณะที่ Micron 7600 Max (6.4TB) อยู่ที่อันดับล่างสุดของแผนภูมิด้วยความเร็ว 6,960.6MB/s
128K Sequential Write Latency (IODepth 16 / NumJobs 1)
เมื่อพิจารณาถึงความหน่วง การทดสอบ 128K Sequential Write ถูกดำเนินการที่ IODepth 16 ด้วยงานเดียว เทียบกับ IODepth 256 ที่หนักกว่าซึ่งใช้ในการเตรียมการ ตามที่คาดไว้ ความหน่วงลดลงอย่างมากในทุกไดรฟ์ Micron 9550 Max (12.8TB) ยังคงเป็นผู้นำด้วยความหน่วงต่ำสุดที่ 0.18ms แสดงให้เห็นถึงความสามารถในการรักษาปริมาณงานสูงสุดด้วยความล่าช้าที่น้อยที่สุด
Kingston DC3000ME (7.68TB) ตามมาอย่างใกล้ชิดที่ 0.24ms โดยมี Pascari X200P (7.68TB) ตามมาเล็กน้อยที่ 0.24ms ในขณะเดียวกัน Solidigm PS1010 (0.28ms) และ SanDisk DC SN861 (0.28ms) มีผลลัพธ์ที่คล้ายคลึงกัน ในขณะที่ Micron 7600 Max (6.4TB) อยู่ที่อันดับสุดท้ายด้วย 0.29ms
128K Sequential Read (IODepth 64 / NumJobs 1)
เมื่อเปลี่ยนไปเป็นการอ่าน การทดสอบ 128K Sequential Read ทำให้ผลลัพธ์ใกล้เคียงกันมากขึ้นในบรรดาไดรฟ์ที่แข่งขันกัน Pascari X200P (7.68TB) ขึ้นเป็นอันดับหนึ่งที่ 14,242.1MB/s นำหน้า Solidigm PS1010 (7.68TB) ที่ 14,163.3MB/s และ Micron 9550 Max (12.8TB) ที่ตามมาทันทีที่ 14,047.5MB/s ไดรฟ์ทั้งสามนี้อยู่ในช่วงแคบๆ แสดงความแตกต่างที่น้อยมากในโลกแห่งความเป็นจริงในปริมาณงานอ่านแบบต่อเนื่องที่สม่ำเสมอ
Kingston DC3000ME (7.68TB) ตามหลังกลุ่มผู้นำเล็กน้อยที่ 13,513.8MB/s ในขณะที่ SanDisk DC SN861 (7.68TB) ให้ผลลัพธ์ 12,631.2MB/s ที่ปลายด้านล่าง Micron 7600 Max (6.4TB) อยู่ที่ 11,240.5MB/s ซึ่งเป็นไดรฟ์เดียวในกลุ่มที่ต่ำกว่าเกณฑ์ 12GB/s
128K Sequential Read latency (IODepth 64 / NumJobs 1)
เมื่อพิจารณาถึงความหน่วง การทดสอบ 128K Sequential Read (IODepth 64 / NumJobs 1) เน้นย้ำว่าการแข่งขันนั้นเข้มข้นเพียงใดในบรรดาผู้ที่ทำผลงานได้ดีที่สุด Pascari X200P (7.68TB) เป็นผู้นำด้วย 0.56ms เกือบจะเท่ากับ Solidigm PS1010 (0.56ms) และ Micron 9550 Max (12.8TB) ที่ 0.57ms ไดรฟ์ทั้งสามนี้ถือว่าเสมอกัน โดยสะท้อนถึงช่วงที่แคบที่เราเห็นในปริมาณงาน
Kingston DC3000ME (7.68TB) ตามมาด้วย 0.59ms ในขณะที่ SanDisk DC SN861 (7.68TB) อยู่ที่ 0.63ms Micron 7600 Max (6.4TB) อยู่ในอันดับสุดท้ายด้วย 0.71ms ซึ่งสอดคล้องกับแบนด์วิดท์การอ่านแบบต่อเนื่องที่ต่ำกว่า
64K Random Write
ในการทดสอบ 64K Random Write, Micron 9550 Max (12.8TB) แสดงช่วงประสิทธิภาพที่กว้าง ตั้งแต่ต่ำสุดประมาณ 2.45GB/s ไปจนถึงสูงสุด 10.6GB/s โดยมีค่าเฉลี่ย 7.34GB/s ตลอดการทดสอบ ซึ่งไม่เพียงทำให้เป็นผู้ที่มีประสิทธิภาพสูงสุดเท่านั้น แต่ยังเป็นไดรฟ์เดียวที่สามารถปรับขนาดได้อย่างต่อเนื่องเกินกว่า 10GB/s ที่คิวเดปธ์สูงขึ้น Micron 7600 Max (6.4TB) แสดงความสม่ำเสมอที่แข็งแกร่ง แต่มีเพดานประสิทธิภาพที่ต่ำกว่า โดยอยู่ในช่วง 2.39GB/s ถึง 6.8GB/s และมีค่าเฉลี่ย 5.16GB/s ซึ่งทำให้มันอยู่ในอันดับที่สองอย่างมั่นคง ตามหลัง 9550 Max แต่ก็ยังนำหน้าคู่แข่งส่วนใหญ่ในแผนภูมิ
เมื่อพิจารณาจากกลุ่มที่เหลือ Kingston DC3000ME (7.68TB) และ SanDisk DC SN861 (7.68TB) อยู่ในช่วง 4-6GB/s โดยทั่วไปแข่งขันได้ แต่ไม่สามารถปรับขนาดให้เท่ากับระดับ Micron ได้ Solidigm PS1010 (7.68TB) และ Pascari X200P (7.68TB) อยู่ในกลุ่มล่าง โดยมักจะอยู่ในช่วง 2-4GB/s ตามหลังไดรฟ์ Micron ทั้งสองอย่างมีนัยสำคัญ
64K Random Write Latency
ในแง่ของความหน่วง Micron 9550 Max (12.8TB) ให้ผลลัพธ์ที่สม่ำเสมอที่สุด โดยมีค่าเฉลี่ยเพียง 0.30ms โดยมีค่าสูงสุดไม่เกิน 1.71ms แม้ที่คิวเดปธ์ที่หนักกว่า Micron 7600 Max (6.4TB) ตามมาด้วยค่าเฉลี่ยที่สูงกว่าเล็กน้อยที่ 0.41ms และค่าสูงสุดที่ 2.3ms ยังคงควบคุมได้ดีภายใต้ภาระงาน Kingston DC3000ME และ SanDisk DC SN861 อยู่ในกลุ่มกลาง โดยความหน่วงโดยทั่วไปอยู่ในช่วง 0.05ms ถึง 2.7ms ในขณะเดียวกัน Pascari X200P และ Solidigm PS1010 แสดงความผันผวนที่มากที่สุด โดยสูงถึง 4.1ms และ 6.0ms ตามลำดับ ที่คิวเดปธ์สูงขึ้น
64K Random Read
ในการทดสอบ 64K Random Read ไดรฟ์ Micron ทั้งสองตัวให้ผลลัพธ์ที่แข็งแกร่งด้วยค่าเฉลี่ยที่ใกล้เคียงกันมาก Micron 9550 Max (12.8TB) อยู่ในช่วง 0.49GB/s ที่ปลายด้านต่ำไปจนถึงสูงสุด 13.7GB/s โดยมีค่าเฉลี่ย 6.96GB/s Micron 7600 Max (6.4TB) แสดงโปรไฟล์ที่คล้ายกัน โดยเริ่มต้นที่สูงกว่าเล็กน้อยที่ 0.61GB/s สูงสุดที่ 11.0GB/s และมีค่าเฉลี่ย 6.94GB/s ตลอดการทดสอบ
จากแผนภูมิที่กว้างขึ้น เราเห็นว่าไดรฟ์อย่าง Solidigm PS1010 และ Pascari X200P สามารถทำความเร็วได้ถึงช่วง 13-14GB/s ที่คิวเดปธ์สูงขึ้น ทำให้มีความได้เปรียบเล็กน้อยในปริมาณงานสูงสุดเมื่อเทียบกับ Micron Kingston DC3000ME ตามมาอย่างใกล้ชิดในช่วง 12-13GB/s ในขณะที่ SanDisk DC SN861 อยู่ในระดับต่ำกว่าเล็กน้อย โดยคงที่ประมาณ 12.3GB/s
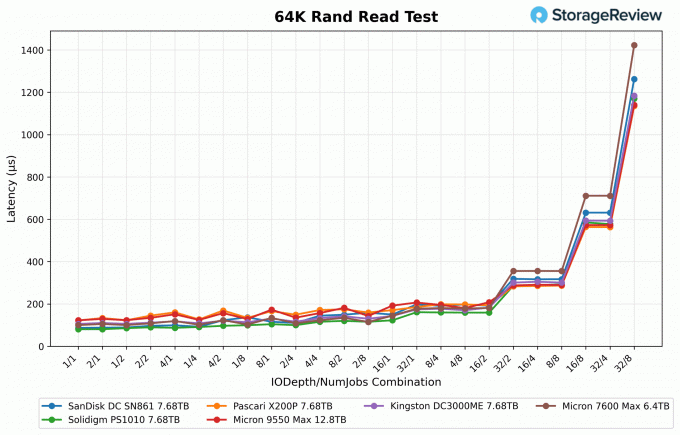
64K Random Read Latency
ในการทดสอบ 64K Random Read, Micron 9550 Max (12.8TB) รักษาโปรไฟล์ความหน่วงที่แข็งแกร่ง โดยมีค่าเฉลี่ย 0.25ms โดยต่ำสุดที่ 0.12ms และสูงสุดถึง 1.14ms ภายใต้ภาระงานที่หนักกว่า Micron 7600 Max (6.4TB) ให้ตัวเลขที่คล้ายกันมาก โดยมีค่าเฉลี่ย 0.26ms ลดลงถึง 0.10ms แต่เพิ่มขึ้นเล็กน้อยถึงสูงสุด 1.42ms ไดรฟ์ Micron ทั้งสองตัวให้ความหน่วงที่เสถียรโดยรวม โดยอยู่ในกลุ่มที่ใกล้เคียงกับกลุ่มที่เหลือส่วนใหญ่ในการทดสอบ
เมื่อพิจารณาจากแผนภูมิ Solidigm PS1010 และ Pascari X200P แสดงความหน่วงที่สูงขึ้นเล็กน้อยในช่วงสั้นๆ โดยทั่วไปอยู่ในช่วง 0.1 ถึง 1.2ms ในขณะเดียวกัน Kingston DC3000ME และ SanDisk DC SN861 ตามมาอย่างใกล้ชิดในช่วงเดียวกัน โดยสูงสุดเกิน 1.2ms ในบรรดาไดรฟ์ที่ทดสอบทั้งหมด ไดรฟ์ Micron ยังคงแข่งขันได้และสม่ำเสมอ โดยมีความแตกต่างเพียงเล็กน้อยที่แยกออกจากกลุ่มชั้นนำที่เหลือ
ผู้ติดต่อ: Ms. Sandy Yang
โทร: 13426366826